This page has been moved to isd.canyonsdistrict.orgData DashboardData Dashboard is an online resource that allows teachers and administrators in the Canyons School District to view and sort scores from a variety of assessments their students take.
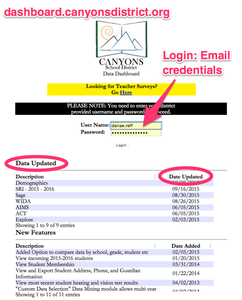
Entering the Data DashboardIn your chosen browser, please visit http://dashboard.canyonsdistrict.org/. Use your email credentials to log in to the dashboard. You can also see what data has been recently updated with the date the information was updated.
|
Pros:1. Used to identify early warning siganls
2. Includes student demographics and results from SAGE, AIMS, SRI, ACT, Explore, PLAN, and CBM tests. Cons:1. Data is not automatically uploaded. Check the login page for most recently added data.
Links:
Documentation:
| ||||||||||||||||||||||||
Student Search
The Student Search fields at the top of the screen make it simple to search for specific students. Enter the student’s name there and click the Search button or press the return key on your keyboard to be directed that student’s information.
Customizing Views
Several different buttons are provided on every screen of the dashboard that allow you to customize your viewing experience. The Hide/Show buttons for Courses and Graphs give you more or less detail - depending on your preferences - and the Select Display Options button takes you into a section where additional preferences can be set. Once you have selected a course, a Hide/Show button for Students becomes visible.
While the Hide/Show buttons allow you to toggle what sections you see directly onscreen, the Select Display Options buttons take you to a different screen. From the Dashboard Display Options screen, you can choose which data you prefer to be displayed.
Dashboard Display Options
For graphs, the display options are: Bar Graph or Pie Graph. With the Pie Graph you can choose to display percentages, values or both. You may also choose not to display any of the information. For Explore/Plan/ACT and AIMS Web Assessment Data you may set the information by row, meaning (for example) that you prefer that all Explore data be shown as a Bar Graph.
You may also choose to see all the graphs by selecting the Set All Graphs button, on the left side of the screen. Additionally, you may select that view for an entire grade level. For better results, use the Set By Grade button before clicking the Set All Graphs button. Once you’ve selected the data you want and how you want it displayed, click on any one of the Go buttons on the screen to view the data.
(For convenience, there are several Go buttons on the screen. A click on any one of them will do the same thing.)
(For convenience, there are several Go buttons on the screen. A click on any one of them will do the same thing.)
Building Level Data
As a teacher, you will have the ability to access overall data for the school. You will also drill down into any data related to your class. For other buildings you have access to see school and grade level graphs only.
Rev: 10/2015


